How to quickly view applications’ memory use with smem

Introduction
In my programming work I often need to know memory use by applications. Rough estimate is usually enough, before getting down to details and browser profiling tools.
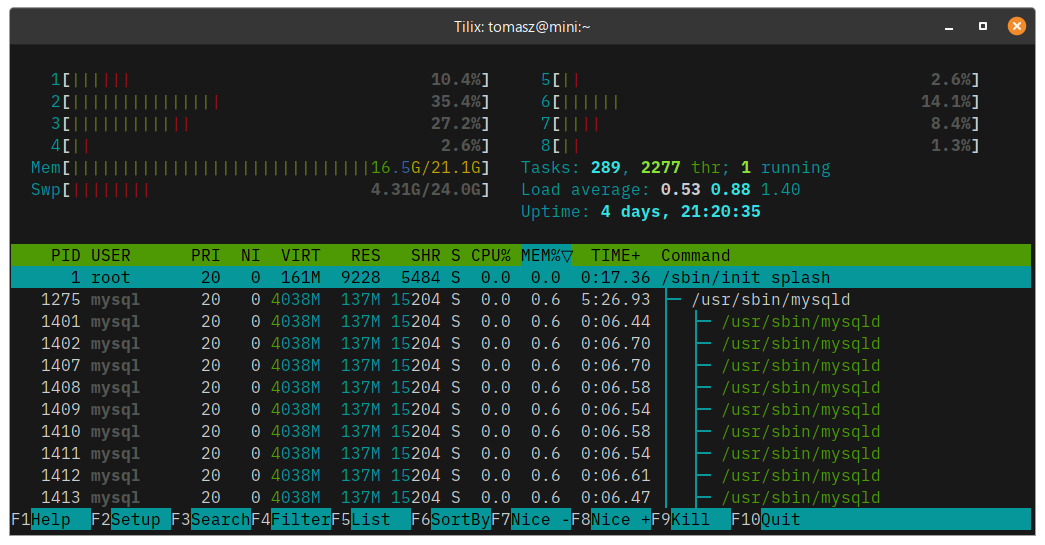
To interrogate memory use on Linux or MacOS we typically use top or htop. I’d love to see a single number: how much RAM did a process take. But statistics shown by these utilities can be hard to understand. With web browsers it’s even more difficult, because they often run many separate processes. The same is true for Electron-based applications such as Visual Studio Code. They will all show up in top output as a long list, each with its own individual metrics.
Enter smem command
Luckily there is smem, another command-line utility for viewing memory use statistics. Install it with package manager of choice, for example:
sudo apt install smem
To get total memory use by Firefox, do:
smem -c pss -P firefox -k -t | tail -n 1
What happens here?
-cswitch specifies columns to show. We’re only interested in pss column which shows memory allocated by a process.-Pswitch filters processes to include only those with firefox in the name-kswitch tells to show memory use in mega/gigabytes, instead of plain bytes-tswitch displays the totalstail -n 1filter outputs only the last line, just where the totals are
The output is as simple as it gets:
$ smem -t -k -c pss -P firefox | tail -n 1
4.9G
Straight to the point! And, after another busy day of work, with over fifty opened tabs, Firefox still uses only 5 GB. Take that, Google Chrome ;-)
Even easier with a script
For convenience, create a little script named memory-use, which takes process name as parameter. I keep all my scripts in ~/bin, so:
echo 'smem -c pss -P "$1" -k -t | tail -n 1' > ~/bin/memory-use && chmod +x ~/bin/memory-use
Now I can measure memory use of any application as easy as:
memory-use firefox
memory-use chrome
memory-use slack
…and there is even more!
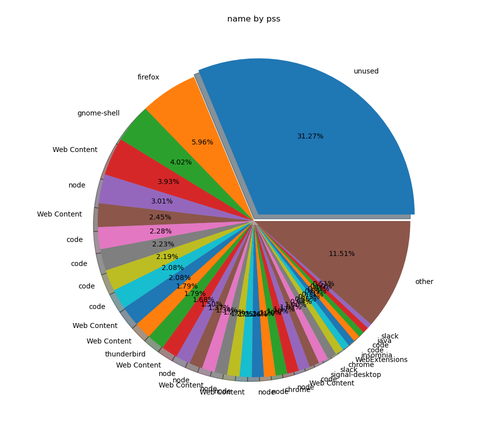
The utility can do much more than just show the total memory use. It can even generate graphic output. Try for example:
smem --pie name -c pss
to see something like this:

For more details I recommend looking into smem man pages.
Another great tutorial can be found at https://linoxide.com/memory-usage-reporting-smem/.
Enjoy!